
Questions are the new answers
A figure becomes 'true' in Irish housing not by being checked, but by being repeated
This post attempts to make a similar point as the previous piece about the Housing Commission estimated deficit - another example of how in Ireland, a number based on questionable calculations gets laundered through repetition.
In this instance it is the affordability gap based on the ‘real’ cost of construction for a three-bed semi-detached house reported in the Society of Chartered Surveyors Ireland’s Real Cost of New Housing Delivery 2023
The SCSI produced these costings based on “some of the most up-to-date construction and market data” and the report says its data “ensures strong, evidence-based policy recommendations for housing delivery across the country”.
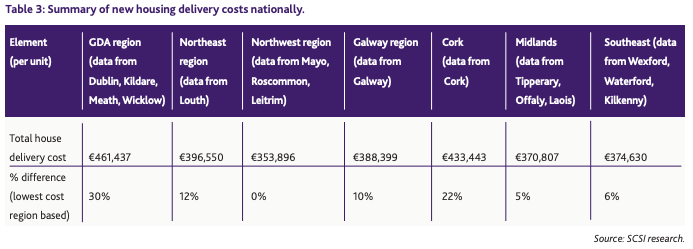
On average, the cost of delivering a three-bedroom semi-detached home ranges from €354,000 in the Northwest region, to over €461,000 in the GDA. The overall average delivery cost of a new three-bedroom semi-detached house is 30% higher in the GDA when compared to the lowest delivery cost of the Northwest region
So far, so good. Exactly what one would instinctively expect. Land costs would be significantly higher in the Greater Dublin Area (GDA, which combines Dublin, Kildare, Meath and Wicklow). Labour would also understandably be higher, as would a myriad of other costs.
The regional headline figures of build costs looked about right and in the rush to justify or judge government policy everybody ran with them. Straight into press releases, opposition speeches, industry submissions and explainer pieces, repeated as hard evidence of the cost of building a home in Ireland.
The 2023 report attempts to base costings on a standardised house — a 114 square metre, three-bedroom semi-detached, built to a standardised specification — and prices it across seven regions, from the Greater Dublin Area down to the Northwest. It is a genuinely useful exercise, specifically intended to enable regional comparison and a more ambitious one than the SCSI’s earlier (Dublin-only) reports. The output everyone quoted is the headline total: a 3-bed semi costs €461,437 to deliver in the GDA, falling to €353,896 in the Northwest — a spread of about 30% top to bottom, or about 15% on the “hard costs” of actually building the house.
That spread is the expected story. If the variation lived only at the level of the totals, there would be nothing questionable at all.
But the report doesn’t stop at totals. It publishes the full build-up for each region — every line, to the euro. And once you line those build-ups up side by side, the tidy 15% spread on the subtotal dissolves into something much stranger underneath.
And nobody appears to have looked closer at the component costs that make up the total. These costs should have at the very least given pause for thought.
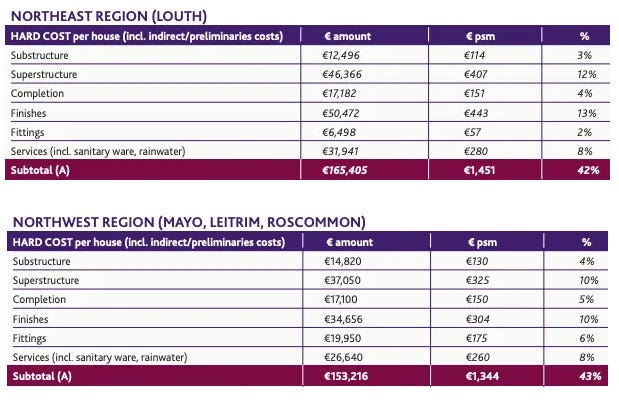
There are some odd regional differences in the costs of fittings, finishes and services. They are standardised precisely to enable comparison, but direct comparison raises more questions than answers. “Fittings” comprise of a fitted kitchen with a formica worktop, no appliances, and a wardrobe to the main bedroom. According to the report, that standardised specification costs €6,498 in the Northeast region and €19,950 in the Northwest. Same kitchen. Same wardrobe. Three times the price.
The numbers that don’t make sense
Here are the hard-cost components — the physical building of the house — for the same specified 3-bed semi, region by region.
Table 1: Hard-cost components of an identical 3-bed semi (€), by region
Look first at the bottom row. The subtotal varies by about 17% from cheapest to dearest — the credible, expected story. Now look at Finishes, Fittings and Services, and the picture inverts.
Fittings range from €6,498 (Northeast) to €19,950 (Northwest) — a factor of three.
Finishes range from €26,912 (GDA) to €50,472 (Northeast) — nearly double, and pointing the “wrong” way, with the supposedly cheaper Northeast the most expensive of all, Dublin the cheapest.
Services range from €20,338 (GDA) to €34,697 (Galway) — a swing of 70%. And again Dublin is the cheapest. Totally counterintuitive.
These are not abstract cost categories. The report tells you exactly what is in them. Fittings is “fitted kitchen with formica worktop, no appliances, and wardrobe to main bedroom”. Finishes is “triple-glazed windows; paint grade softwood doors, skirting and window boards internally; paint-finished walls; and, tiling to bath and shower rooms.” Services is “quality-grade sanitary fittings; solar panel; heat recovery; heat pumps; underfloor heating/radiators; plastic electrical fittings and pendants throughout; and, wired for alarm.”
These are deliberately standardised items, to a standardised specification, in every region. A wardrobe is a wardrobe. Tiling is tiling. The materials are bought on national, often international, markets. If anything, labour to finish and fit these items in the Northwest is cheaper than in the Greater Dublin Area, not three times dearer.
So why does the same fitted kitchen and wardrobe cost €6,498 in Louth and €19,950 in Mayo? There is no physical reason it should. And here is the quietly important part: when you sum the lines, these wild swings largely cancel out, which is why the subtotal still looks sensible. What one region’s surveyors appear to have booked under “fittings,” another’s seem to have folded into “finishes” or “completion.” The total survives; the components do not.
That points, fairly strongly, to the variance in part being an artefact of how the data was assembled — a survey of around 80 separate developer submissions, priced and categorised by different chartered quantity surveyors who allocate costs to headings inconsistently — rather than a real signal about regional building costs. But I want to stress: I don’t actually know that. Nobody does. The report doesn’t explain the divergence, and as far as I can find, in almost three years nobody ever asked it to. Which is the whole point of this piece.
Why it matters: the viability table
If this were just a curiosity in an appendix, it might seem pedantic to question it. It isn’t, because the report uses these figures to do something consequential: it calculates, region by region, whether building a house is “viable” — whether the delivery cost is covered by the market value. And those findings on viability have been used to underpin, justify and extend government policy and spending, specifically Help to Buy, First Home Scheme and development levy waivers.
On the report’s total figures, the headline that travels from this is seductive and tidy: new homes only stack up in the most expensive markets; everywhere else, building loses money. That is a powerful claim, and it feeds directly into the argument that the State must step in to “bridge the viability gap.”
But that €2,599 surplus in the GDA is smaller than the unexplained variance on a single hard-cost line. The fittings figure alone moves by nearly €13,500 between regions for no obvious reason. A viability result that turns on €2,599 is being computed to a precision the underlying data cannot possibly support.
If these figures were produced to make a case for private market financing or investment rather than government policy, any entry level accountant would take one look at them and say “Your viability problem here is obvious. Stop sourcing your tiles in Louth, buy them in Dublin instead.”
So what does that look like? I took the three components that one would expect not to vary significantly by region — Finishes, Fittings and Services — and standardised them: I assigned every region the lowest value any region recorded for each (the cleanest, if deliberately aggressive, way to strip out the inconsistency). Then I let that flow through the rest of the build-up. This matters, because the report calculates developer margin as a flat 15% of costs and VAT on top of that — so when you reduce the cost base, the margin and the VAT charged on it fall too. I used each region’s own implied rates, so I’m not importing any assumption of my own.
Here is what happens.
Standardising three line items that should not vary by region flips the picture. The story becomes “GDA, Galway and the Northeast are viable, and the Northwest is essentially at breakeven.” Every remaining deficit roughly halves. And these aren’t trivial adjustments: the Northeast moves by over €47,000, because its €50,472 finishes figure — the single largest outlier in the dataset — was carrying both a 15% developer margin and VAT on top.
There is a necessary caveat here. Taking the lowest value is the most aggressive defensible choice; using the median would move everything in the same direction but less far. The point of the exercise isn’t to claim these are the true costs — I am not a QS, and cannot be sure of the true costs any more than the next layman. The point is that the viability conclusion is extraordinarily sensitive to component figures the report itself never justifies. Change numbers that have no physical reason to differ, and the headline finding reorganises itself.
The actual problem
None of this is an accusation against the SCSI of acting in bad faith. Lobbyists will lobby. They published their methodology, they were transparent that the figures came from member submissions, and they explicitly caution that the viability table “should not be interpreted as regions that are financially unviable for new homes development.” They did, in fairness, flag their own caveats.
The problem is what everybody else did with it. The €461,437 figure, and the “only Dublin is viable” framing, were picked up and recirculated as established fact — by industry bodies welcoming it as objective evidence, ministers justifying billions in subsidies, opposition politicians wielding it against the Government, government parties wielding it against the opposition, opposition manifestos using it as basis for their alternative affordable housing costings, economists in media op-eds and so on and so on. It became a fixed point that all parties reasoned from. And not one of them, as far as I can establish in almost three years of looking, scrutinised it closely enough to notice and question why the same wardrobe should cost three times more in one county than another.
This is the bit I keep coming back to. The information needed to question the figure was never hidden. It was printed in the report in plain numbers. The €19,950 fitting cost and the €6,498 fitting cost are on facing pages. Anyone who read past the headline to the second table would have seen it. The failure here isn’t in the production of the number — it’s in the reception of it. A figure becomes “true” in Irish housing not by being checked, but by being repeated.
And because it was never questioned, we are now stuck. I can show you that the components don’t make physical sense. I can show you that standardising them moves the conclusion. What I cannot tell you — what nobody can tell you — is why the figures look the way they do, whether the variance is pure classification noise or whether some of it is real, and therefore how much weight the viability conclusion can actually bear. That question can only be answered by the people who compiled the data, and it will never be answered if nobody is sufficiently curious to ask.
This blanket acceptance of figures that don’t add up is endemic in all aspects of commentary, debate, analysis and policy on the housing crisis.
We see a figure that confirms what we already think, and accept it blindly. We don’t ask the right questions because we think we already know the answers. A figure becomes ‘true’ in Irish housing not by being checked, but by being repeated.
NOTE: There is a second oddity in the same tables, and it is purely a matter of how the report is presented. In Section 2, the hard cost figures for two regions — the Greater Dublin Area and the Northwest — are printed in ordinary roman type. The figures for the other five regions are italicised. There is no key, footnote or note anywhere in the report explaining the distinction. In cost reporting, italics are conventionally used to flag figures that are estimated, derived or carried over rather than directly measured — it is unclear whether that is what is meant here, because the report doesn't say, and the pattern doesn't resolve neatly either way (the Northwest is roman, yet it is the region carrying that €19,950 fittings figure). The point is narrower and, by now, familiar: it is just another example of something that should stop a careful reader and prompt a question.