
The Census Wasn’t Wrong. We Changed the Question.
The third in a series on how housing figures in Ireland become “true.” The first two showed how a soft number gets accepted. This one shows how a hard number gets dismissed.
The first two posts in this series were about figures that were embraced. The Housing Commission’s deficit and the SCSI’s cost of delivery are both built on assumption and estimates — headship rates Ireland has never produced, a survey of preferences, a developer margin struck as a flat percentage, component costs that swing threefold for no physical reason — and both were waved through into press releases and policy as though they were measurements. They became “true” not by being checked but by being repeated. At first glance, the figures supported what we thought to be true, so they were never questioned.
This post is about the opposite reflex. It is about what happens when a figure points the wrong way — when it contradicts what we already believe. Then the machinery runs in reverse. The number is questioned, picked at, denigrated, dismissed and ultimately set aside, and again not through any rigorous analysis but through the steady repetition of congenial doubt.
The two failures are the same failure wearing opposite clothes. Groupthink does not care about the quality of the evidence. It simply asks: does this number agree with what we already believe? If it does, it becomes hard fact, however soft its construction. If it doesn’t, it becomes unreliable, however robust its construction.
The credence attached to a figure is set by its conclusion, not its method. And the standards are not merely inconsistent — they are inverted. In the examples here, the more assumption-laden the figure, the more firmly it is believed; the more rigorously it was measured, the more readily it is discarded. Ireland has decided to trust its guesses and to doubt its measurements.
There is no cleaner example of this than the dismissal of consecutive census vacancy figures. For almost a decade the ability of the Central Statistics Office to accurately count the number of vacant properties has been repeatedly questioned over two censuses.
A number that pointed the wrong way
Prior to 2017, no serious person ever questioned whether the Central Statistics Office could count. Counting is what it does, it’s raison d’être. Its output carries an implicit authority, and ministers and media would reach for that authority whenever it suited them.
Then, in 2016, the CSO counted something inconvenient. The census recorded over 200,000 vacant homes and a national vacancy rate of 12.3 per cent — stripped of holiday homes, they found 183,312 vacant, habitable dwellings, a rate just over 9%. The number was awkward. The figure did not automatically disprove the housing emergency. But it complicated the simplest version of it. It implied a stock of empty homes that sat uneasily beside the political story of pure scarcity. And so, for the first time, the CSO’s ability to count was put on trial — not strictly its methodology in any technical sense, but its answer.
The reaction was not to ask what the figure meant. It was to find a better one. Within a few months of the CSO releasing the figures, the discourse had a more congenial measure to hand - GeoDirectory - and, within a few years, another - the CSO Electricity meter count. The Census vacancy figure — the product of the largest and most systematic enumeration exercise the State performs — was effectively retired from the conversation, replaced by numbers that told people what they wanted to hear.
How the yardstick was switched
You can watch the switch happen in real time, in the same publication, by the same authors, across three editions.
GeoDirectory — the An Post and Ordnance Survey address database — publishes a residential buildings report twice a year. In its Q2 2016 and Q4 2016 editions, the vacancy section simply reports the Census figures as authoritative. There is no rival measure. The CSO count is the count.
Then the Census figure came under public attack upon release in April 2017. And in the next edition of the report, August 2017, GeoDirectory introduced its own vacancy measure — one that came in at roughly half the Census figure. It is worth quoting the explanation from the report in full, because of what it does (emphasis added):
“Based on the above definitions, GeoDirectory report a vacant stock of 96,243 address points or units in June 2017, while the 2016 Census reported a vacant stock of 183,312 address points or units, as of April 2016. Thus the GeoDirectory figure is around half the Census figure, which is a substantial difference, of the order of 87,000 dwellings. The average vacancy rate across the State is 4.9 per cent, according to GeoDirectory (Figure 10), compared with 12.3 per cent, according to the Census of Population.
Drilling down further, however, it is possible to explain some of this substantial difference. The CSO has provided some data on the reasons why vacant dwellings were vacant at the time of the Census of Population for a small sample of vacant buildings (i.e. around 57,000 dwellings or close to one-third of the total). For this one-third of vacant dwellings, they include dwellings classified as for sale (10,948 dwellings), for rent (10,350), owner in nursing home (4,165), renovation work underway (3,678), owner in hospital (1,469), and owner with relatives (847).
Some of these categories could be construed as dwellings which might not normally be classified as vacant in the context of vacant long term, but would represent more of a transition or temporary vacancy rate, i.e. while properties are waiting to be sold or rented out. In the aggregate they represent a total of around 31,500 properties out of the 57,000, or 55 per cent, implying that 25,500 of this total would be deemed to be vacant. As these explanations were only provided for one-third of vacant dwellings, (if it is assumed that 55 per cent of the remaining two-thirds were similarly classified, leaving 45 per cent as representing the true vacant total) this would reduce the CSO figure for the number of vacant dwellings considerably to around 83,000, which would be closer to the GeoDirectory figure of 96,243.”
Read what is happening there. The Census count is not being corrected. It is being explained downward until it lands near GeoDirectory’s own figure. The method is to take the reasons the CSO recorded for one-third of vacant homes, decide that more than half of them — the ones for sale, for rent, mid-renovation, owner in a nursing home — are not “really” vacant, and then assume the same proportion holds for the two-thirds nobody has data on. An assumption applied to a sample, extrapolated across the unmeasured remainder, to arrive at a number that chimes with the expectation. This is the deficit’s reverse-engineering, run on vacancy.
And notice precisely what is being struck out as “not really vacant”: homes for sale, homes for rent, homes between uses. That is not noise. That is the single most important category of vacancy there is. A functioning housing market requires a layer of empty homes in transition — properties available for someone to buy, to rent, to move into — because that is the slack that lets people move at all, the liquidity that makes the market function. Strip it out and you have not corrected the count. You have deleted the most important thing a point in time vacancy figure exists to capture, and called the deletion an improvement.
Of course the for sale and rent reasons recorded for vacancy in the census do not correlate to what was actively listed for sale and rent on the market at the time. That alarm bell should have been the very reason to drill down into the data further and seek out what it was telling us. Instead, in as far as the discrepancy was even acknowledged, it was used as evidence to cast doubt on the accuracy of the count. We never questioned the accuracy of the reasons, and thus missed the opportunity to learn something from the answers.
GeoDirectory’s measure, incidentally, rests substantially on whether a dwelling is receiving post. The Census used trained enumerators making repeat visits, looking for furniture, cars, accumulated mail, an overgrown garden, and asking the neighbours — and was instructed that one or two visits were not enough to call a property vacant. The report sets both methods out on the same page. It then treats the postman’s round as the corrective to the enumerator’s count. Once GeoDirectory’s lower figure had become an acceptable yardstick, the caveat against the Census quietly disappeared from later editions. The job was done.
Census 2022 suffered the ignominy of having to include its own caveat, which in itself became a citable reason to cast doubt on the accuracy and usefulness of the figures. For the record Census 2022 found a national vacancy rate of almost 8%.
The CSO also added its own electricity-based measure in 2022 — a dwelling drawing almost no power across four consecutive quarters. It is a good answer for the right question, and an honest one. But it measures one specific thing: long-term, sustained emptiness. Like GeoDirectory’s, it is designed to strip out exactly the transitional, frictional vacancy that the Census captures. None of this would matter if everyone kept the measures straight. The problem is what came next: the long-term measures became the headline “vacancy rate,” and were then used to answer questions they were never built to answer.
Apples and oranges
Consider a piece earlier this year from the think tank Progress Ireland, arguing that land hoarding and speculation are not major drivers of the housing crisis. To make the case, it turns to vacancy, and again it is worth quoting at length:
Nevertheless, we do have a lot of data on the vacancy rates of dwellings. Data about vacancy rates (or “long term” vacancy, ie four consecutive quarters) comes from the CSO. If a dwelling is using less than 180 kilowatt-hours per quarter, then it is considered vacant.
If the modern Georgist idea is right, that hoarding valuable sites is a widespread and consequential problem, then we would expect to see high levels of vacancy. More than that, we would expect to see high levels of vacancy in the highest demand areas. Withholding an unpromising piece of land would make for dubious speculation.
The second thing to say about vacancy is some level of vacancy is not just expected, but is desirable.
Policymakers sometimes refer to a “healthy” vacancy rate of about 5 per cent. The reason why a functional system should have some vacancy is that people move around. If all homes are filled, then mobility falls. That means, people can’t move to better jobs, to be nearer family, or to downsize. A functional system will have some mobility as people move jobs or relocate for other reasons.
The third thing to expect is that areas with high demand will have lower levels of vacancy than areas with lower demand. A healthy system will match people to empty homes faster in areas with higher demand. You should expect prosperous cities to have lower vacancy rates than sleepy villages.
As George said, unusually high levels of vacancy is a symptom of “hoarding” or speculation. So, how is Ireland faring?
Across Ireland, vacancy levels have been falling.
Dublin in particular has unusually low levels of vacancy. In South Dublin, the vacancy rate hovers around just 1 per cent. In Dún Laoghaire, vacancy levels are at just 0.9 per cent. As you would expect, vacancy levels outside of Dublin and Cork city are typically higher.
It begins admirably precise about which measure it is using:
“Data about vacancy rates (or ‘long term’ vacancy, ie four consecutive quarters) comes from the CSO.”
Long-term vacancy. Stated plainly, defined exactly. So far, this is the disciplined thing to do. But watch what the same passage builds on top of that definition:
“Policymakers sometimes refer to a ‘healthy’ vacancy rate of about 5 per cent. The reason why a functional system should have some vacancy is that people move around. If all homes are filled, then mobility falls... A functional system will have some mobility as people move jobs or relocate for other reasons.”
This is the switch, and it is so smooth it is almost invisible. The “healthy 5 per cent” being invoked is a benchmark for total vacancy — it describes precisely the moving-around, the transitional slack, the homes between tenancies and sales. It is a frictional concept. But the figure being measured against it is the long-term rate, the four-quarters-dark rate, which is built to exclude exactly that mobility. The argument compares a number that captures only the dead stock against a benchmark that describes the living, breathing churn — and concludes the market is short of slack. The two are not the same quantity. You cannot measure the breathing with an instrument designed to filter the breathing out.
The same move runs through the rest. The piece says, correctly, that “areas with high demand will have lower levels of vacancy than areas with lower demand.” On the long-term measure, that holds — South Dublin shows around 1 per cent. But include the frictional vacancy that the Census counts and the highest-demand parts of Dublin do not uniformly show the lowest vacancy, quite the opposite. The highest-demand areas of Dublin have the very highest vacancy rates, some in excess of 10%. The conclusion depends entirely on keeping the frictional layer out of frame.
And then the international comparison, which is the tell:
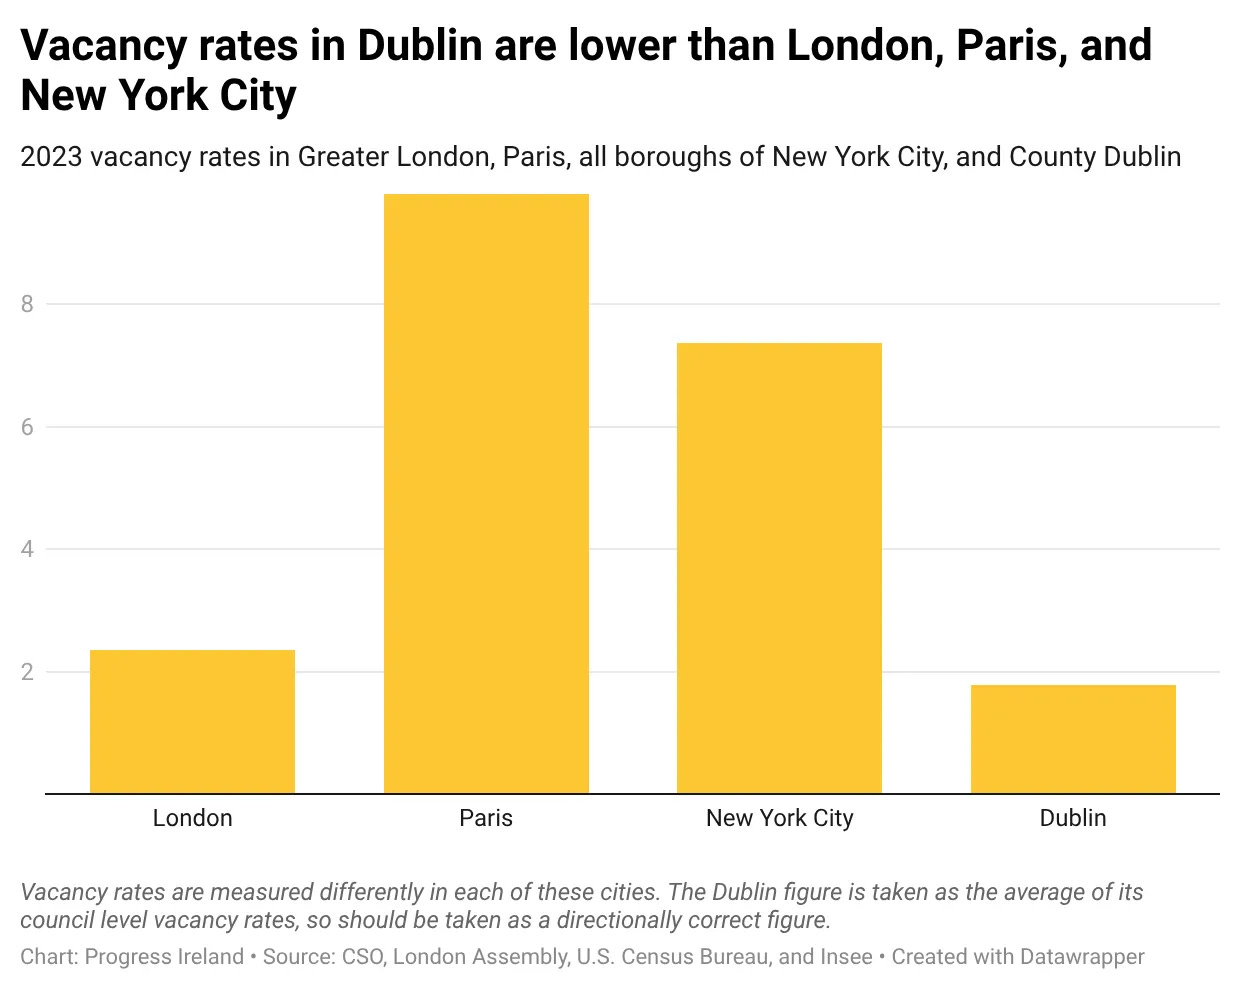
“The levels of vacancy in Dublin are unusually low by international standards. New York, Paris, and London all have higher vacancy rates than Dublin.”
The figures for Paris and New York are total vacancy figures — INSEE and the US Census Bureau count all vacant dwellings, frictional and long-term together. The note on the chart acknowledges that rates are measured differently, but this is not even close to comparing like with like. It is comparing Dublin’s dead-stock-only number against other cities’ all-vacancy numbers and declaring Dublin unusually low. Compare apples with apples — total against total — and the gap narrows substantially or vanishes. The “unusually low by international standards” claim survives only on the strength of measuring Dublin one way and Paris and New York another.
This is not a swipe at Progress Ireland, nor the author of the piece. It’s just one example of a pervasive error. For other examples see the Housing Commission, the Dept of Finance, respected housing economists, Irish Times opinion pieces and letters to the editor. It’s everywhere.
The recency of the Progress Ireland example shows the culmination of a decade of misguided discussion about something which originally was little more than political inconvenience and public incredulity. Now we have a housing expert at an influential think tank that has the ear of the government unwittingly comparing apples with oranges, and using that comparison to state with authority “the levels of vacancy in Dublin are unusually low by international standards.”
Why a good number feels wrong
There is a reason that able, honest people make this error, and the geographer Rob Kitchin, in a paper titled “Data debates in urban development: the data politics of facts and counter-facts”, calls it out precisely:
“Property and planning analysts and market actors usually possess a wealth of phronesis and metis that, when confronted with data that presents a different picture to their grounded experience, can spark feelings of unease or bewilderment and seed a sense of distrust in a dataset.”
Phronesis and metis are the practical, experiential knowledge that comes from working in a field — the estate agent who knows there is nothing to rent, the official who knows the emergency is real. That knowledge is valuable. But Kitchin’s point is that when a measurement contradicts it, the instinct is not to ask whether the experience is incomplete. The instinct is to distrust the measurement. The number feels wrong, so it must be wrong.
That is the whole story of the Census vacancy figure. It conflicted with what everyone knew — that there was nothing to rent or buy, that the crisis was acute — and so it was assumed to be flawed. Nobody stopped to consider that both things could be true at once: that the stock on the market could be desperately tight and that the Census was accurately counting a large number of homes empty on a given night, because those are answers to two different questions. The unease did its work. The figure was distrusted into irrelevance, and softer numbers that matched the grounded experience took its place.
The acid test
Here is the test. To dismiss the Census vacancy count, you have to commit to a single proposition: that the Central Statistics Office — a body whose only ideology is accuracy — cannot accurately count empty houses. Not “cannot interpret why they are empty.” Cannot count them.
Say it plainly and it falls apart. Nobody will seriously defend the sentence ‘the CSO cannot count’ once it is written down. And yet it is the load-bearing assumption beneath a decade of housing commentary. We have preferred, in effect, to trust the postman over the census-taker — not because the postman’s method is better, but because his number was more comfortable.
The issue is not whether the CSO can count. It is whether commentators are entitled to treat a narrower measure of long-term vacancy as if it disproves a broader Census measure of total vacancy.
None of this is an argument that there is a silver bullet waiting to be fired. It is an argument about making sure we understand the root causes of the problem, eliminate blind spots, and resist groupthink. It is an argument about which evidence we are allowed to take seriously, and on what grounds.
The Census is a measurement. It deserves to be engaged with as one — interrogated, yes, but not waved away because its answer is unwelcome. The Census figure is not self-interpreting. It does not tell us why homes are empty, how long they have been empty, or how many could be brought back into use. But it does tell us that they were counted as empty under a consistent national method.
The deficit and the cost figures are estimates, and deserve to be weighted as estimates, not laundered into facts. We have it exactly backwards.
And once you see that, a larger thing comes into view. Almost every confident proclamation about how to solve the housing crisis rests on assumptions — about population growth, migration, household formation, how many people want to live alone or with others. These are not measurements. They are projections, and a projection is only as good as its assumptions, which in this debate were chosen to point in a congenial direction while the measurements that might have disciplined them were set aside. The solutions everyone argues about are downstream of those assumptions. Which means the debate that looks like a debate about solutions is really an unexamined debate about assumptions — and that debate has scarcely happened.
Start instead from a different assumption — that the CSO can count, that the measurements are real — and a different diagnosis comes into view, and with it a different set of questions. Not because that diagnosis is certainly right; it rests on its own assumptions, and they would need their own scrutiny. But because it reveals that the confident answers everyone repeats were never forced by the evidence. They were one branch of a tree, and nobody walked down the others, because the measurement that pointed toward them had already been dismissed on the grounds that the national statistics office cannot count.
Two consecutive censuses were telling us something we did not understand, and we have ignored that for a decade while the problems have grown progressively worse.
The first step to solving those problems is to stop pretending we already know all of the answers.
Excellent and incredibly insightful.